A Python script to make sense of multi-dimensional Splunk exports

A little while ago I wrote about grouping data by multiple fields in Splunk, which is a very useful function that produces hideous export files. I took some time to write a Python script to fix that and make the data a lot more useful for further analysis.
For reference, here’s what the CSV export from Splunk looked like after I looked at some traffic to some fictional IP addresses and analysed how many times each port was targeted:
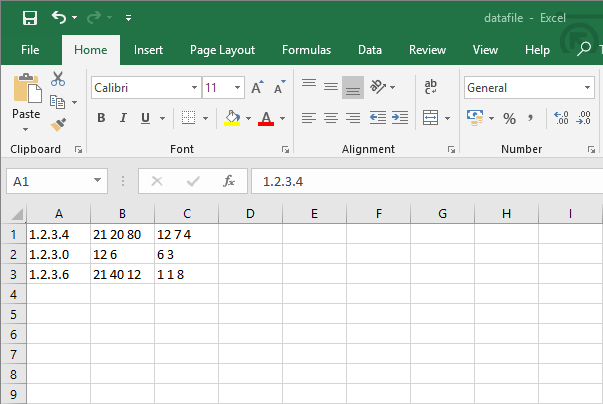
The problem with this data is that it’s not very easy to use. The ports and counts of events targeting them for each IP address are in single cells, with only spaces to separate the figures. However, it’s not too difficult to rectify this issue with a quick Python script.
Setting things up
First of all, let’s open the files we’ll need to work with while processing our data. This isn’t too complicated in this case as there are only two files involved.
data = open("datafile.csv", "r")
newdata = open("dataexport.csv", "a")
The “data” file is pretty self-explanatory – that’s the CSV file that Splunk gave us when we exported our results. The “newdata” file is a new CSV where we’ll be writing the data in the new, more useful format after it’s been run through our processing script.
Splitting Splunk’s CSV data
Next we’ll need to iterate through Splunk’s data line by line and split it in the right places to fill some variables for use in our own output. Luckily this is quite a simple task because CSV files use commas to separate columns and returns to separate rows.
for line in data:
    parts = line.split(",")
    ip = parts[0]
    ports = parts[1]
    counts = parts[2]
    ports_list = ports.split(" ")
    counts_list = counts.split(" ")
For each row in the CSV we create a list called “parts” that contains entries for each cell, which are separated by commas in the source file. From there, we assign the first cell to a variable called “ip”, the second to a variable called “ports”, and the third to a variable called “counts”.
The ports and counts variables still contain multiple entries thanks to Splunk’s export format, so we perform the same process to split them into list entries based on the spaces between them. We now have an IP and equal lists of ports and counts of events targeting those ports.
counts_list[-1] = counts_list[-1][:-1]Time for a little housekeeping. Because the counts were the last data in each row, the final count still contains the new line (“\n”). To rectify this, we select the final entry in the counts list and remove the final two characters from the end of it. Our data’s now ready to use.
Writing new lines to the export file
Now we just need to iterate through the separated data and write it to the new export file in a more workable format. First, I establish a variable to track which port we’re dealing with, which will be used to match the items in the ports and counts lists.
    current_port = 0
    for port in ports_list:
        exportline = ip + "," + port + "," + counts_list[current_port] + "\n"
        newdata.write(exportline)
        current_port += 1
Then it’s just a matter of working through each port in the list, creating a line that contains the IP address, the port, and the relevant count with a new line at the end. These values are separated by commas to split the cells in the CSV file.
data.close()
newdata.close()
Once all the values have been appended to the new export file, the only thing left to do is to close both the source file and the new file so other programs can access them.
The output
When our sample data is run through the Python script, the output looks like this:
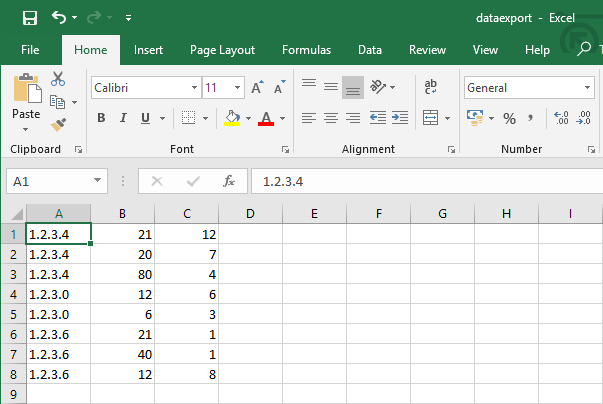
This is far more useful than the format Splunk originally exported the data in, and can be much more easily used for further analysis using Excel tools like pivot tables.
A note: I’m only just delving into the world of Python, and these posts are as much to get things straight in my own head as they are to show them to others. If anything looks wrong, or there’s a more efficient way of doing something, please let me know!
Photo by Soraya Irving on Unsplash