Liverpool will win the Premier League, according to my Python predictor

I had a week off recently, so for a bit of fun I embarked on my most ambitious and most complex Python project yet: to scientifically (kind of) predict the outcome of the 2018/19 Premier League season based on the results so far. Those who are particularly fond of buzzwords might even call the result machine learning, although I wouldn’t myself.
I’ll go into more detail later in the post, but put simply, the idea was to take all of the Premier League results so far and put them into a results grid. The script would then populate any empty cells by comparing the two teams’ records against other teams they have both played, and against each other, before assembling a final league table.
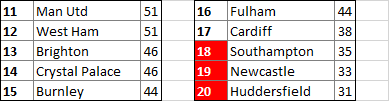
The results? Jurgen Klopp’s Liverpool side will lift the Premier League trophy in May, with Chelsea, Manchester City, and Arsenal making up the rest of the top four. Tottenham and Bournemouth will take the Europa League places, while Southampton, Newcastle, and Huddersfield will find themselves in the Championship for the 2019/20 season.
This is all just for fun, of course, and if the limitations of this approach aren’t already obvious then they will be when I go into more detail in a moment. The output will become more accurate as more results come in, but it’ll interesting to see how close the table below is to the final results when the curtain comes down at the end of the year.

So how exactly does the script work? Here are the main functions in order of execution. The full script is about 400 lines long, so these are just highlights, but feel free to download the full Python file to look it over if you wish – I’d be interested to hear your thoughts!
establish_grid()
The first step was to create the grid that will hold all of the result data. I used the ultra-useful pandas library for this, so it was a matter of creating a column for each team with twenty rows and creating a dataframe that I could query and amend in each of the following functions.
vals = {'ARS':["","","","","","","","","","","","","","","","","","","",""],
        [...]
       }
df = pandas.DataFrame(data=vals)</pre>
I then iterated through the cells where the column and row numbers were equal, adding an X to each one so the script never attempted to make teams play themselves.
for i in range(0,20):
   df.iloc[i][i] = "X"</pre>
With a grid in place, I could begin parsing the existing real-world results.
parse_results()
I scraped the results from a sports website and put them in a CSV file in the format: “Chelsea,1,Liverpool,1”. I could then iterate through each line in the CSV, splitting the score into each team’s name (which I replaced with an ID number) and goal counts.
score = score.split(",")
home_team, home_score = score[0], score[1]
away_team, away_score = score[2], score[3]</pre>
I then calculated whether each result was a win, loss, or draw for the home team and added the team IDs and result to a line that I added to a new CSV of parsed results.
if home_score > away_score:
    line = home_team + ",W," + away_team + "\n"
elif home_score == away_score:
    line = home_team + ",D," + away_team + "\n"
else:
    line = home_team + ",L," + away_team + "\n"
    scores_parsed.write(line)
I was now left with a CSV file full of parsed results in the format: “5,D,11”, where the two numbers are the team IDs for Chelsea and Liverpool and the D signifies a draw.
results_to_grid()
To make it possible to query and add to those results it was necessary to add them to my pandas dataframe, so I iterated through the new CSV to split them into team IDs (which correspond to the grid coordinates) and added the results to the relevant cells.
for score in scores_parsed:
    score_parts = score.split(",")
    h = int(score_parts[0])
    r = score_parts[1]
    a = int(score_parts[2])
    df.iloc[h][a] = r</pre>
By now I had a results grid containing all of the Premier League results so far this season and it was time for the tricky part: predicting the results of the remaining matches.
check_results()
To do this, first the script needed to identify which grid cells were empty and needed analysing. So I started by iterating through the cells and finding the blank spaces.
for i in range(0,20):
    for n in range(0,20):
        h = i
        a = n
        cell = df.iat[h,a]
        if cell == "":
            analysis()
            df.iloc[h][a] = result
        else:
            pass
If a cell has anything in it (i.e. it has a real-world result, or an X because the row team and the column team are the same) it is ignored. When a blank cell is identified, the analysis() function is run. This function populates the result variable, which is fed into the empty cell.
analysis()
This is where the bulk of the script’s logic happens, and for this reason it took the most time to put together. For this function I had to consider what would make one team more likely to beat another, and how to handle each of those factors in terms of code and weighting.
After some consideration, I decided to use a points system based on a comparison of the teams’ results. I iterated through each Premier League team and compared how many points the home and away teams had won against them. For example, if Liverpool had beaten Arsenal but Chelsea had lost to Arsenal, I would award some overall points to Liverpool.
if h_pts > a_pts:
    h_main_pts += 3
elif a_pts > h_pts:
    a_main_pts += 3
I then checked to see whether the two teams in question had already played each other in the reverse fixture. If they had, I awarded a slightly higher number of points to the winner.
a_h_res = df.iat[a,h]
if a_h_res == "W":
    a_main_pts += 4
elif a_h_res == "L":
    h_main_pts += 4</pre>
To begin with, this was all the result was calculated on, but I realised that the table that was produced was purely by the numbers and didn’t account for some of the nuances of Premier League football. Unfortunately, there’s no way to program factors like form, injuries, and drama into an algorithm, so I introduced some randomness and upsets by awarding the home team in each fixture some bonus points to give them a greater chance of winning.
You can guess what happens next: The two teams’ points totals are compared and if the difference is great enough then a winner is declared. Otherwise, the game is a draw.
if h_main_pts - a_main_pts > 3:
    result = "W"
elif a_main_pts - h_main_pts > 3:
    result = "L"
else:
    result = "D"</pre>
Note the variables at play here. How many points should a team get if they have better results against an opponent than the other? How many points should they get for beating the other team earlier in the season? How many points should they get as a home advantage? And how great should the difference between the tallies be before a win, rather than a draw, is given?
The answers to all of these questions are subjective. I tuned them through a trial-and-error process, adjusting each value and checking the resulting table against the final tables from previous Premier League seasons until the points tallies for the champions, European qualifiers, and relegated teams were about right without any major outliers.
As we saw before, the check_results() function then takes the result variable and puts it in the correct cell. By the end of the process, all of the cells in the grid are filled.
calculate_points()
This function pretty much speaks for itself. It iterates through each team’s row, adding three points to their total for each win and one for each draw, as per the FA rules.
for n in range (0,20):
    cell = df.iat[i,n]
    if cell == "W":
        points += 3
    elif cell == "D":
        points += 1
    else:
        pass
The process is then repeated in reverse for the team’s column to add points won on the road, and the total is added to a dictionary of team names and their corresponding tallies.
produce_table()
Naturally, the last step was to compile and print my complete Premier League table. Firstly, I created another pandas dataframe with two columns – one for names and one for points.
final_data = {'A':["","","","","","","","","","","","","","","","","","","",""],
              'B':["","","","","","","","","","","","","","","","","","","",""]
              }
df1 = pandas.DataFrame(data=final_data)
I then worked through the teams for the final time, reassigning recognisable names and adding them to the data frame along with their points totals. The last step was to sort this data by points (descending) and then team name (ascending) and print it to the screen.
df1 = df1.sort_values(by=['B','A'],ascending=[False,True])
print df1.to_string(index=False,header=False)
And there you have it – definitive scientific proof (not really) of how the 2018/19 Premier League season will finish! Perhaps I should have wrapped this post in spoiler tags…
Post-match analysis
On that topic, I’d like to reiterate that this is just for fun. Scripts cannot accurately calculate the effects of things like injuries, weather, and rogue beach balls – not to mention the January transfer window – and through extreme enough changes to the variables I mentioned earlier you could probably make just about any club you wanted champions.
That said, I tried to be as fair and scientific as I could, and I’ll certainly be revisiting this prediction in May next year to see just how good my script was. In the meantime, I’d be interested to hear if anyone’s tried anything like this before and what approach you took. Leave a comment below and let me know what you think!
A note: I’m only just delving into the world of Python, and these posts are as much to get things straight in my own head as they are to show them to others. If anything looks wrong, or there’s a more efficient way of doing something, please let me know!
Photo © Kane Brooker (CC BY 2.0). Cropped.